Acquisition Geometry
Slice Thickness
 |
 |
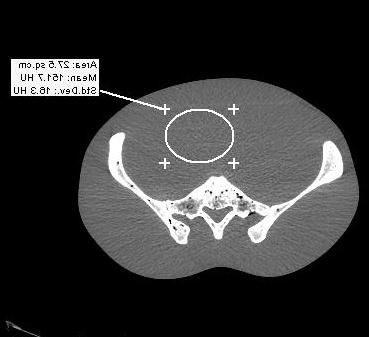
| Figure E. Images acquired using a detector configuration of 4 x 1.25 mm on a four slice CT scanner, and reconstructed using a 1.25 mm slice thickness (left) and 5 mm slice thickness (right). |
The number of x-ray photons that are used to generate most radiographic images is the primary determinant of the amount of noise (mottle) in the resultant image. Quantum noise limited imaging systems are those, including CT, where other sources of noise (e.g., electronic) are negligible. For quantum noise imaging systems, quadrupling the number of x-ray photons used to make an image will halve the resultant amount of image noise. Figure E shows the effect on image noise when the reconstructed slice thickness increases from 1.25 mm (left) to 5 mm (right). As expected, the 5 mm thick image has half noise (8.6 HU) of the 1.25 mm thick image (16.3 HU) because the 5 mm thick image uses four times as many photons to reconstruct the image (photons used is directly proportional to slice thickness). pitch ratio
Helical imaging was introduced in the late 1980's to increase the image acquisition time, particularly in body imaging. In helical imaging, the patient continuously moves through the CT gantry, and the x-ray tube continuously rotates around the gantry. To reconstruct an image at a given long axis location requires approximately 1000 projections at all the x-ray tube angles around the patient; in helical CT, only one projection is acquired directly by the CT scanner, and all of the remaining projections are obtained by interpolation from projection data that is available upstream and downstream of the selected location at each x-ray tube angle.
Helical CT scanning is described by defining the pitch ratio, which is the ratio of the distance moved by the table (patient) in one rotation of the x-ray tube divided by the nominal x-ray beam width. A helical scan performed using a pitch ratio of 1 corresponds most closely to contiguous axial scanning. Pitch ratios that are less than 1, as is commonly used in prospective cardiac CT, will have regions of the patient that are directly irradiated in more than one rotation of the x-ray tube, whereas pitch ratios greater than 1 will reduce patient doses by introducing gaps where the some patient regions will not be directly irradiated.
 |
 |
| Figure F. Image of an abdominal anthropomorphic phantom acquired using a pitch of 0.75 (left) and 1.5 (right). Apart from the difference in pitch, the CT acquisition techniques and reconstruction algorithms were kept constant. |
Figure F shows two images generated at two pitch ratios, 0.75 (left) and 1.5 (right), and where all the other technique factors and reconstruction algorithms are kept constant. The mean values in the selected region of interest are the same (~ 149) as expected. The measured noise values are also the same, 8.7 (pitch 0.75) versus 8.4 (pitch of 8.4), and this is to be expected. Data for reconstructing a helical slice are obtained by interpolation of two images obtained upstream and downstream from the slice of interest. Interpolating from two images may be considered to be a form of data averaging, and reconstructed images generally have lower noise than the corresponding axial image obtained with no interpolation. For single slice CT scanners, choice of pitch will have little effect on the measured noise, but increasing pitch will broaden the slice sensitivity profile which is a measure of resolution along the long patient axis.